Snowflake Warehouse Sizing: The Spill and Queue Signals That Tell You Up or Out
How to pick a Snowflake warehouse size from evidence instead of intuition, using spilling, queueing, and scaling tests to decide between a bigger warehouse and more clusters.
- ✓Doubling warehouse size doubles the credit rate, so a query that scales linearly costs exactly the same and finishes twice as fast.
- ✓Remote spilling is the one unambiguous signal to size up. Local spilling is a warning, not an emergency.
- ✓Queueing means add clusters, not size. Mixing the two fixes is how teams end up with an idle XL.
- ✓Test a size change with the result cache off and the same data, or you are measuring caching, not compute.
- ✓Start every new warehouse at X-Small and let evidence promote it. Nobody has ever regretted starting too small.
Table of contents
- The mental model: one query versus many
- Spilling is the signal to size up
- Queueing is the signal to scale out
- How to actually test a size change
- Sizing by workload class
- Where teams get this wrong
- FAQ
- Is a bigger warehouse always more expensive?
- What about Snowpark-optimized warehouses?
- Should I use one warehouse per dbt model?
- How does query acceleration service fit in?
- Does warehouse size affect data loading throughput?
- What this means for your pipelines
Warehouse sizing is the question I get asked most and the one people reason about worst. The usual mental model is that a bigger warehouse is more expensive, so you should use the smallest one you can tolerate. That model produces slow pipelines and saves nothing.
Here is the arithmetic that changes the conversation. An X-Small burns 1 credit an hour. A Small burns 2, a Medium 4, a Large 8, and so on up. Each step doubles the rate and also roughly doubles the compute resources available. If your query scales — if it can use the extra threads and memory — it finishes in half the time and costs the identical number of credits. Size is free when work parallelizes.
The whole discipline is therefore about detecting the cases where work does not parallelize, and about telling apart the two very different problems that both look like “the warehouse is slow.” One is a single query that cannot fit in memory. The other is twenty queries fighting for one warehouse. The first wants a bigger size. The second wants more clusters. Applying the wrong fix is how accounts end up with an idle Extra Large and a queue that never went away.
The mental model: one query versus many
Draw the distinction before you touch anything.
A warehouse is a cluster of compute nodes. Size determines how many nodes are in one cluster, which determines how much memory and how many threads a single query can use. Multi-cluster determines how many such clusters run concurrently, which determines how many queries can execute at once without waiting.
flowchart TD
  slow["Warehouse feels slow"] --> which{"What does QUERY_HISTORY show?"}
  which -->|"bytes_spilled_to_remote_storage > 0"| up["Size up one step"]
  which -->|"queued_overload_time > 0"| out["Add clusters (scale out)"]
  which -->|"both"| split["Split the workload into two warehouses"]
  which -->|"neither"| sql["It is the SQL, not the size"]
  up --> retest["Re-run the same workload and compare credits"]
  out --> retest
  sql --> prune["Check pruning and scan ratio"]
Two symptoms, two different fixes. Reading the wrong one costs money in both directions.
Nearly every sizing mistake I have cleaned up came from skipping this fork. Someone saw a slow dashboard, sized the warehouse from Medium to Large, halved the queue by accident because the queries finished faster, and concluded that size fixes concurrency. Then the workload grew ten percent and they went to Extra Large.
Spilling is the signal to size up
When a query needs more memory than the warehouse has, Snowflake spills intermediate results to local SSD. If local disk runs out too, it spills to remote object storage. Local spill is slow. Remote spill is catastrophically slow — I have watched a join go from four minutes to fifty-one because it crossed that line.
Remote spill is the one signal I treat as unambiguous. Find it:
select
  query_id,
  warehouse_name,
  warehouse_size,
  round(total_elapsed_time / 1000, 1) as seconds,
  bytes_spilled_to_local_storage  / power(1024, 3) as gb_local_spill,
  bytes_spilled_to_remote_storage / power(1024, 3) as gb_remote_spill,
  left(query_text, 160) as query_text
from snowflake.account_usage.query_history
where start_time > dateadd('day', -7, current_timestamp())
  and bytes_spilled_to_remote_storage > 0
order by bytes_spilled_to_remote_storage desc
limit 25;
Any row here is a candidate for a size increase. Each step up doubles available memory, so a query spilling 20 GB remotely on a Medium will usually stop spilling by Large or X-Large.
Local spill is different. A little local spill on a big aggregation is normal and often not worth paying to eliminate. I start caring when local spill exceeds roughly the volume of data the query scanned, which means the intermediate state has ballooned — usually a fan-out join or a window function over an unpartitioned set.
Before you size up for spill, check whether the query deserves the memory it is asking for. A join that produces 400 million rows from two 10-million-row tables has a join key problem, not a memory problem. Sizing up makes a bug run faster.
Queueing is the signal to scale out
Queueing shows up as queued_overload_time: the query was ready,
the warehouse was full, and it waited. The fix is more clusters,
because clusters are what serve concurrent queries.
select
  warehouse_name,
  date_trunc('hour', start_time) as hour,
  count(*) as queries,
  round(avg(queued_overload_time) / 1000, 2) as avg_queue_sec,
  round(max(queued_overload_time) / 1000, 2) as max_queue_sec,
  round(avg(total_elapsed_time) / 1000, 2) as avg_total_sec
from snowflake.account_usage.query_history
where start_time > dateadd('day', -7, current_timestamp())
  and warehouse_name = 'BI_WH'
group by 1, 2
having avg_queue_sec > 0.5
order by hour;
Grouping by hour matters. Queueing that is concentrated in a
three-hour window is a multi-cluster problem with a clear
MIN_CLUSTER_COUNT of 1 and a MAX_CLUSTER_COUNT sized for the
peak. Queueing spread evenly across the day means the warehouse is
simply undersized for its steady load.
alter warehouse bi_wh set
  warehouse_size = 'MEDIUM'
  min_cluster_count = 1
  max_cluster_count = 4
  scaling_policy = 'STANDARD'    -- favors latency; use ECONOMY for batch
  auto_suspend = 60;
The scaling policy is the underrated knob. STANDARD starts a new
cluster as soon as a query would queue, which is what you want for
human-facing BI. ECONOMY waits until it estimates the new
cluster will stay busy for several minutes, which tolerates a
little queueing in exchange for fewer credits. Batch and
reverse-ETL warehouses belong on ECONOMY.
One more thing that surprises people: extra clusters only cost
credits while they are running. A warehouse configured 1..6 that
sits at one cluster all week bills like a single warehouse. There
is little reason to keep MAX_CLUSTER_COUNT at 1 out of caution.
How to actually test a size change
Do not size by feel, and do not compare yesterday’s run to today’s. Run the same work on both sizes with caching controlled:
-- Disable result cache so you measure compute, not cache hits.
alter session set use_cached_result = false;

-- Baseline
alter warehouse test_wh set warehouse_size = 'MEDIUM';
alter warehouse test_wh suspend;   -- clear the local data cache
alter warehouse test_wh resume;
-- ... run the workload, note query_id ...

-- Candidate
alter warehouse test_wh set warehouse_size = 'LARGE';
alter warehouse test_wh suspend;
alter warehouse test_wh resume;
-- ... run the identical workload ...
Then compare cost, not just runtime, because runtime alone tells you nothing about whether you should keep the change:
-- Credit-equivalent comparison across the two runs.
-- Size multipliers: XS=1, S=2, M=4, L=8, XL=16, 2XL=32, 3XL=64, 4XL=128.
select
  warehouse_size,
  count(*) as runs,
  round(avg(total_elapsed_time) / 1000, 1) as avg_seconds,
  round(
    avg(total_elapsed_time) / 1000 / 3600 *
    decode(warehouse_size,
      'X-Small', 1, 'Small', 2, 'Medium', 4, 'Large', 8,
      'X-Large', 16, '2X-Large', 32, '3X-Large', 64, '4X-Large', 128),
    4
  ) as approx_credits_per_run
from snowflake.account_usage.query_history
where query_tag = 'sizing_test_orders_rebuild'
group by 1
order by approx_credits_per_run;
Three outcomes and what each means. Runtime halves and credits are flat: the query scales, keep the bigger size, you got speed for free. Runtime improves 20 percent and credits nearly double: it does not scale, go back down. Runtime is unchanged: the bottleneck is elsewhere — a remote read, a single-threaded UDF, or a plan that materializes a stage serially.
That third case is common enough to name. Queries dominated by a
Python UDF, a SEQUENCE, or a sort that cannot partition will not
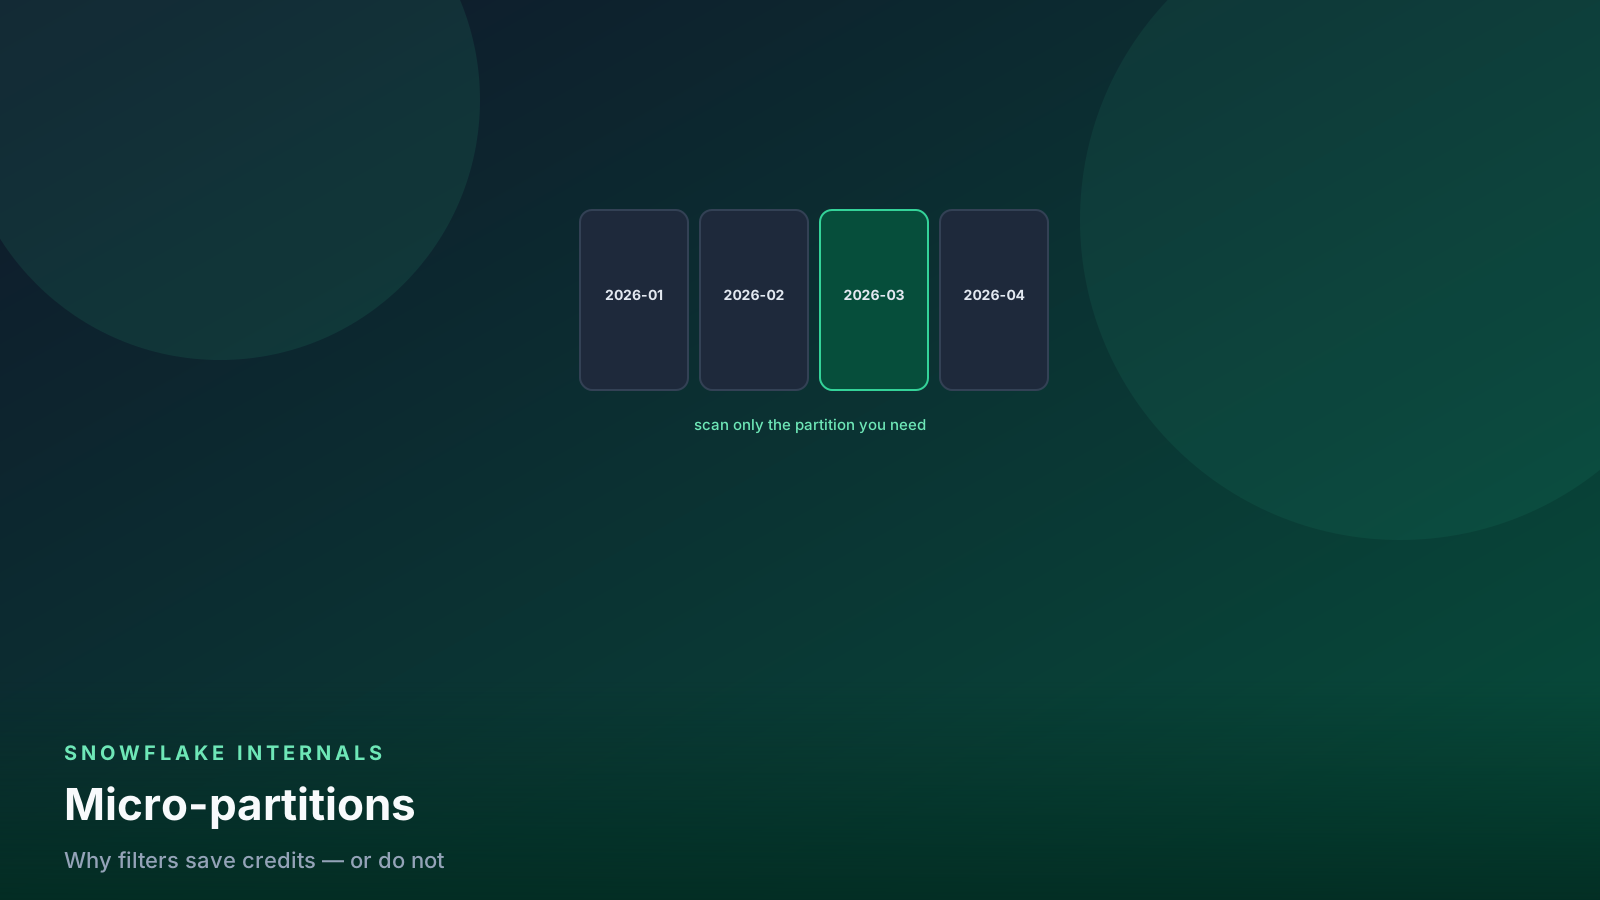
improve at any size. Neither will a query that scans 40 partitions;
there is not enough work to spread across nodes.
Sizing by workload class
My starting points, before evidence adjusts them:
Loading warehouses. X-Small or Small. COPY INTO parallelizes
across files, not across nodes in the way you would hope, and most
load jobs are bound by file count and file size. Splitting a
10 GB file into 200 files does far more than sizing up.
dbt transformation warehouses. Small or Medium to start. Size here is driven by your largest model, not your average one, which is a good argument for splitting a few heavy models onto their own warehouse rather than paying Large for 300 small ones. If you use dbt Slim CI, give CI its own X-Small and never think about it again.
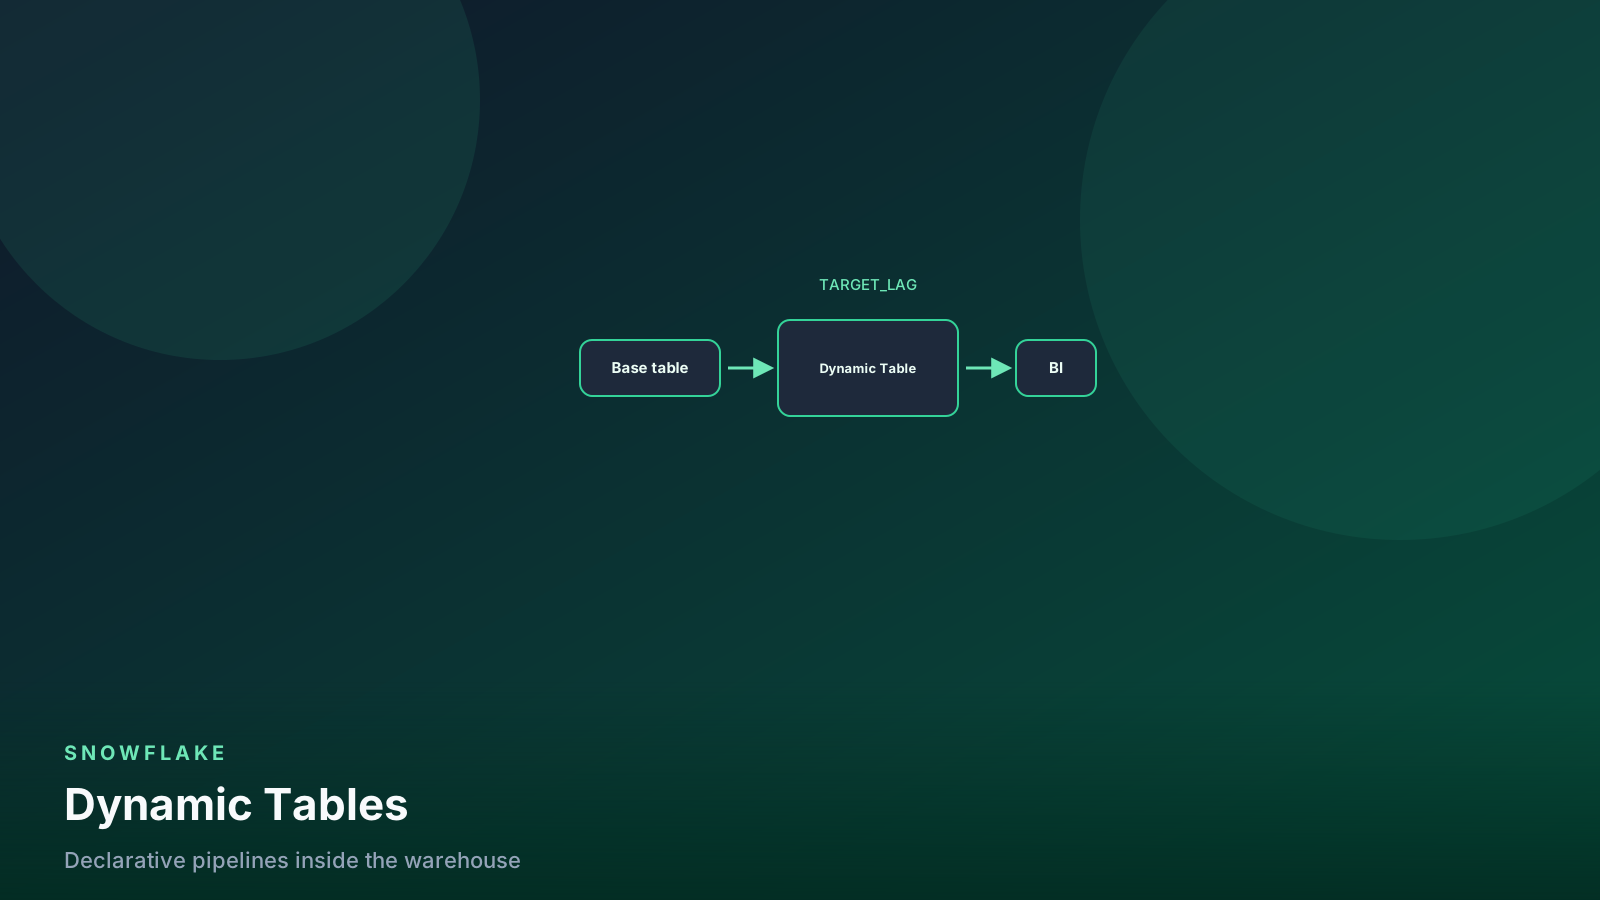
BI warehouses. Small or Medium with multi-cluster 1 to 4. BI is a concurrency workload, and dashboard queries that need a Large are usually querying a table that should have been pre-aggregated. A dynamic table at the right grain beats a bigger warehouse.
Ad hoc and data science. Medium with multi-cluster, an aggressive resource monitor, and a 60-second auto-suspend. This is where unbounded queries live, so guardrails matter more than size.
Where teams get this wrong
Sizing up to fix a full table scan. A bigger warehouse scans
the same partitions faster and costs proportionally more. If
partitions_scanned is close to partitions_total, you have a
pruning problem and
size is the wrong tool entirely.
Adding clusters to fix a slow single query. Concurrency scaling does nothing for one query. It never runs across clusters. If one query is slow, only size, SQL, or data layout will help.
Testing with the result cache on. Your second run returns in
200 milliseconds and you conclude the Large is magic. Set
USE_CACHED_RESULT = FALSE and suspend between runs.
One warehouse for batch and interactive. The nightly rebuild sets the size, the dashboards inherit it, and the credit rate is wrong for both. Two warehouses cost less than one compromise.
Never re-testing. Data volume grows, models change, and the size you chose 18 months ago is now either wasteful or spilling. Put a spill-and-queue report on a monthly schedule alongside the rest of your cost review.
Treating warehouse size as a permission level. I have seen accounts where analysts got an X-Large “because they are senior.” Size is a technical property of the workload, not a title.
FAQ
Is a bigger warehouse always more expensive?
No, and this is the most useful thing to internalize. Credits are rate times duration. Doubling the rate while halving the duration is a wash, and you get the answer twice as fast. It only costs more when the query fails to use the extra capacity.
What about Snowpark-optimized warehouses?
They provide substantially more memory per node and are worth it for memory-hungry Python workloads such as model training or large pandas operations inside a UDF. They also cost more per credit-hour, so use them for the specific jobs that need them rather than as a general default. See Snowpark versus SQL for when that workload should exist at all.
Should I use one warehouse per dbt model?
No. That is over-fragmentation, and warehouse resume overhead starts to matter. What does work is two or three tiers — a default warehouse plus one larger one that your handful of heavy models target via a config override.
How does query acceleration service fit in?
QAS offloads parts of a scan to serverless compute, which can help outlier queries on a warehouse that is otherwise correctly sized. It bills separately, so treat it as an alternative to sizing up for a small number of unusual queries, not as a substitute for fixing a consistently undersized warehouse.
Does warehouse size affect data loading throughput?
Less than people expect. COPY INTO throughput is mostly a
function of the number and size of files, with 100 to 250 MB
compressed files being the sweet spot. Size up only after you have
parallelized the files.
What this means for your pipelines
Sizing should be an output of measurement, not an input to it.
Start every warehouse at X-Small, run real work through it, and let
two columns in QUERY_HISTORY — remote spill and queue time —
promote it. That is the whole loop, and it takes about ten minutes
a warehouse.
The reason this matters beyond the invoice is that size is where teams stop investigating. A dashboard is slow, someone bumps the warehouse, the symptom improves slightly, and the real cause — a wrapped date predicate, a fan-out join, an unpartitioned window function — stays in the codebase and grows. Every time you resist the urge to size up and read the profile instead, you find something you can actually fix permanently.
Build the signals into your regular reporting. A weekly job that lists warehouses with remote spill, warehouses with queueing, and warehouses with neither but high credits will tell you what to change before anyone files a ticket. Sizing then becomes a small, boring, evidence-driven adjustment instead of an argument.
Senior Data & AI Engineer · SnowPro Core & Gen AI Certified
4+ years building production data platforms on Snowflake, Databricks, AWS, and Azure. I write from hands-on experience with Medallion architectures, dbt, Airflow, PySpark, and Snowflake Cortex AI. Every tutorial on this blog reflects real pipeline decisions — not documentation rewrites.
Read more about the author →