Snowflake Cost Optimization: 7 Techniques That Actually Cut the Bill
Warehouse sizing, auto-suspend, clustering, ACCOUNT_USAGE queries, and resource monitors — estimate the bill from usage before you change prod.
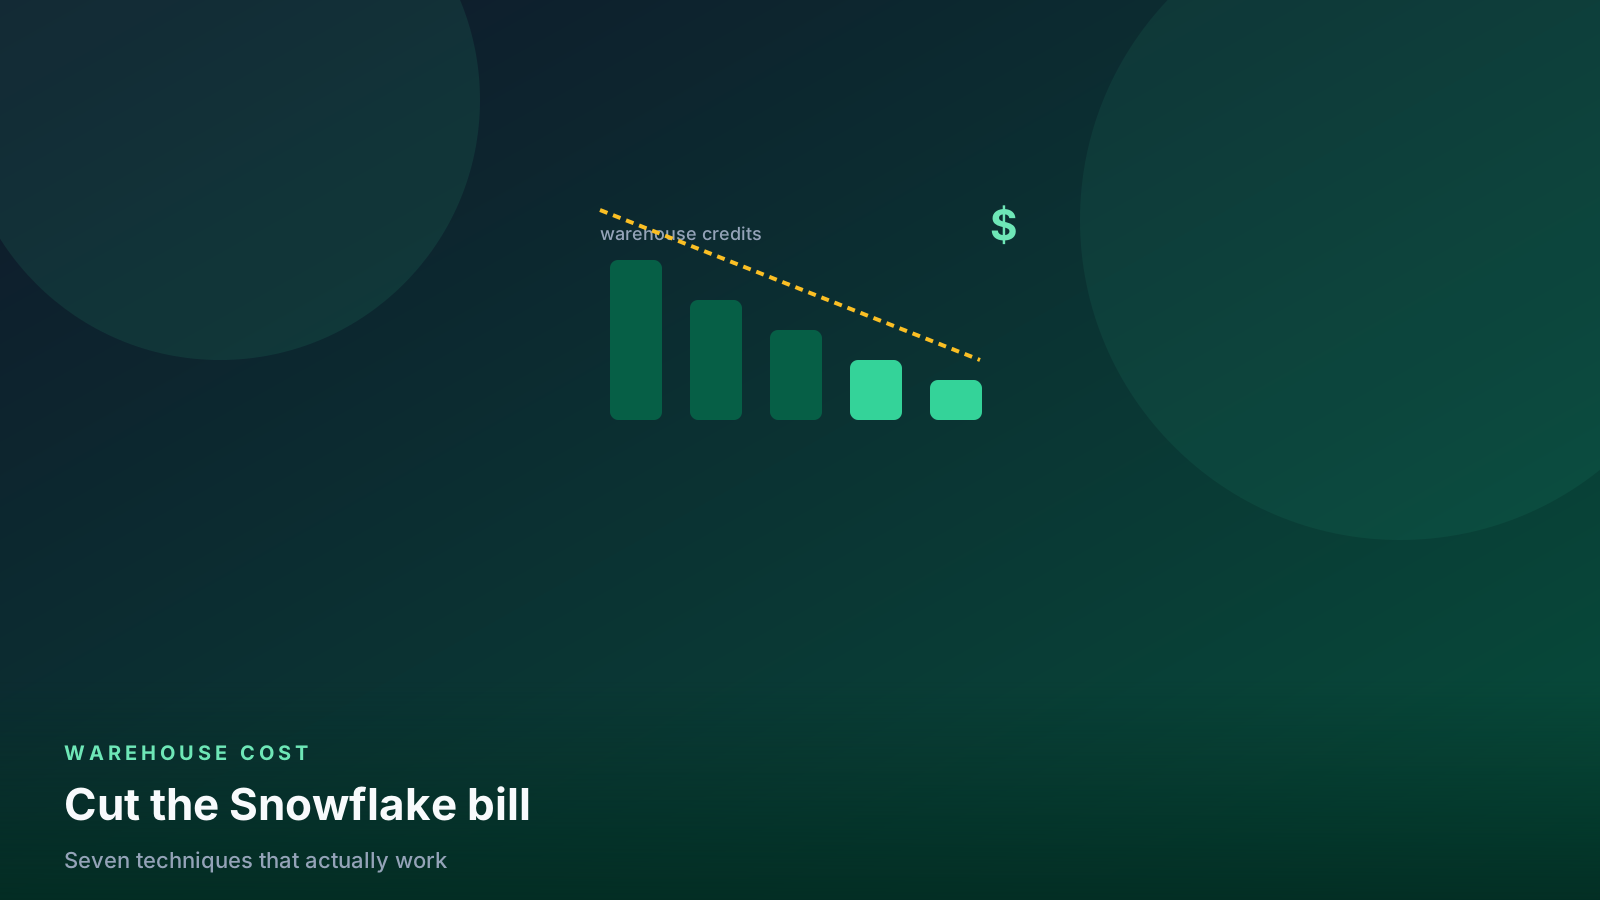
- ✓Auto-suspend at 60 seconds and right-size warehouses beat most other tricks.
- ✓ACCOUNT_USAGE tells you which warehouses and queries actually burn credits.
- ✓Estimate monthly spend from ACCOUNT_USAGE before you change prod.
- ✓Clustering and Search Optimization cost credits to maintain — use them on the tables that earn it.
Table of contents
- 1. Aggressive auto-suspend
- 2. Find out where the money goes
- 3. Right-size warehouses (start small)
- 4. Separate workloads
- 5. Cluster only your biggest tables
- 6. Kill zombie schedules
- 7. Set resource monitors
- Query tags and a hard timeout
- Result cache is not a strategy
- COPY and Snowpipe are not “free compute”
- Time Travel and storage
- The habit that matters
- What I watch after a change
- FAQ
- What this means for data engineers
Snowflake bills compute by the second while a virtual warehouse is running. That means most cost savings don’t require fancy vendor tools or enterprise add-ons — they come from running less time, on smaller warehouses, with smarter query pruning.
💡 The Snowflake Cost Mental Model (In Plain English)
Think of a Snowflake warehouse like a taxi meter. You aren’t paying for how much data you store (storage is cheap, like flat-rate parking). You are paying for every second the taxi engine is turned on and idling. If your taxi sits in traffic or waits at the curb with the engine running for 10 minutes after dropping you off, you’re paying full price for that idle noise. Our goal is simple: turn off the engine the moment the query finishes, and pick a compact sedan instead of an 18-wheeler when hauling a couple of suitcases.
Here is a quick summary of the seven tactics and their typical impact:
| Strategy | Difficulty | Expected Bill Reduction | What it Does |
|---|---|---|---|
| 1. Auto-Suspend to 60s | 🟢 2 minutes | 15% – 35% | Stops paying for idle compute when queries finish |
| 2. Account Usage Auditing | 🟢 5 minutes | Visibility | Pinpoints exact queries & users burning credits |
| 3. Warehouse Right-Sizing | 🟡 15 minutes | 20% – 50% | Scales down oversized warehouses (e.g. XL → Medium) |
| 4. Spilling & Memory Fixes | 🟡 30 minutes | 10% – 25% | Eliminates disk-spill slowdowns and runaway joins |
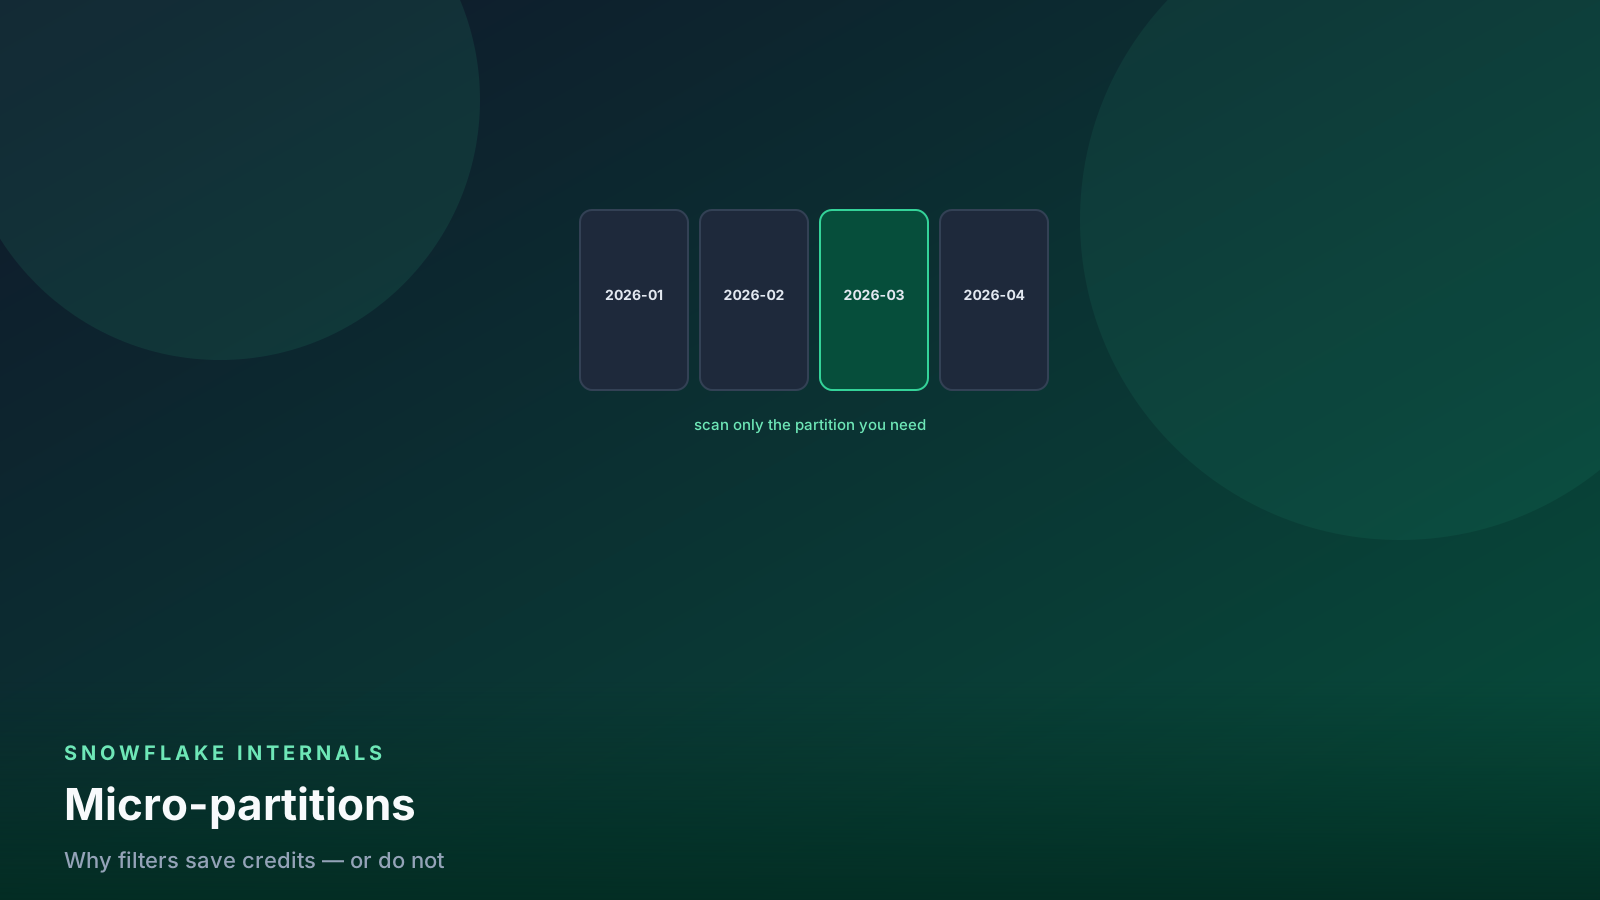
| 5. Partition Pruning | 🟡 30 minutes | 15% – 40% | Scans only the needed micro-partitions instead of entire tables |
| 6. Hard Spend Limits (Monitors) | 🟢 5 minutes | Prevents disasters | Automatically halts runaway warehouses before budget overflows |
| 7. Storage & Time-Travel Cleanup | 🟡 20 minutes | 5% – 15% | Trims 90-day retention on staging/scratch tables |
flowchart LR
  query[Incoming Query] --> warehouse[Warehouse Compute Meter]
  warehouse --> suspend[Auto-suspend at 60s: Saves Idle $$]
  warehouse --> size[Right-Size Warehouse: Halves Credit Rate]
  query --> pruning[Partition Pruning: Scans 90% Less Data]
  warehouse --> monitor[Resource Monitors: Hard Circuit Breaker]
1. Aggressive auto-suspend
The default 10-minute auto-suspend burns money on idle time. For most ELT warehouses, 60 seconds is right:
alter warehouse transforming set
  auto_suspend = 60
  auto_resume = true;
The trade-off is losing the warehouse data cache on suspend. Keep a longer suspend (5–10 minutes) only on BI warehouses where the same dashboard SQL repeats all morning.
If a warehouse never suspends, someone left a session or a tool holding
it. QUERY_HISTORY will show you.
2. Find out where the money goes
Do not optimize a feeling. Look at 30-day credits by warehouse:
select
    warehouse_name,
    sum(credits_used) as credits,
    round(credits * 3.0, 0) as approx_usd  -- your contract rate
from snowflake.account_usage.warehouse_metering_history
where start_time > dateadd(day, -30, current_timestamp())
group by 1
order by 2 desc;
Most expensive queries (last 7 days):
select
    query_id,
    warehouse_name,
    total_elapsed_time / 1000 as seconds,
    partitions_scanned,
    partitions_total,
    left(query_text, 180) as query_text
from snowflake.account_usage.query_history
where start_time > dateadd(day, -7, current_timestamp())
  and execution_status = 'SUCCESS'
order by total_elapsed_time desc
limit 20;
partitions_scanned close to partitions_total is a full scan —
usually a missing filter, a function on the filter column, or a table
that needs clustering.
Multiply credits by your contract rate if you think in dollars.
ACCOUNT_USAGE lags. For “what is on fire right now” use
INFORMATION_SCHEMA query history in the account.
Idle vs scan is a different diagnosis. A warehouse that never suspends is an idle problem. A query that scans every micropartition is a SQL problem. Do not buy a larger warehouse for the first one.
flowchart TD
  bill[Credit spike] --> idle{Warehouse rarely suspends?}
  idle -->|yes| suspend[Auto-suspend + kill held sessions]
  idle -->|no| scan{partitions_scanned ≈ partitions_total?}
  scan -->|yes| sql[Fix filter / clustering / SELECT *]
  scan -->|no| size[Right-size or split BI vs ELT]
Idle first, then scans, then size. Size last.
Who is holding the warehouse:
select
  warehouse_name,
  user_name,
  count(*) as queries,
  sum(total_elapsed_time) / 1000 as seconds
from snowflake.account_usage.query_history
where start_time > dateadd('day', -1, current_timestamp())
  and execution_status = 'SUCCESS'
group by 1, 2
order by seconds desc
limit 20;
3. Right-size warehouses (start small)
Each size doubles credits per hour. A Large that finishes in 10 minutes costs the same as a Medium that finishes in 20 — if the job scales.
If Medium finishes in 12 minutes, you just saved ~40%.
Test one size down on a representative run. Use the mental model that size doubles credits per hour: linear vs “does not scale” cases. Tiny SQL and single-file copies do not scale; big scans and transforms often do.
alter warehouse transforming set warehouse_size = 'SMALL';Multi-cluster is for concurrency, not a substitute for a bigger size. If one query is slow, add size or fix the SQL. If 40 dashboards queue, add clusters.
4. Separate workloads
One warehouse per workload type:
| Warehouse | Work |
|---|---|
loading |
COPY, Snowpipe-adjacent bursts |
transforming |
dbt / Tasks |
bi |
Tableau / Looker / Hex |
A Monday backfill should not force a Large on the CFO’s dashboard. Split warehouses also make the metering view readable.
5. Cluster only your biggest tables
Clustering keys help pruning on multi-terabyte tables that are always filtered the same way (usually a date).
alter table analytics.gold.events
  cluster by (event_date);
Do not cluster a 20 GB dimension. Automatic clustering is a background
credit spend. If automatic_clustering_history costs more than the
queries you saved, drop the key.
select
  table_name,
  sum(credits_used) as clustering_credits
from snowflake.account_usage.automatic_clustering_history
where start_time > dateadd(day, -30, current_timestamp())
group by 1
order by 2 desc;
Search Optimization Service is the other paid accelerator — point lookups (SKU, email), not analytics scans. Enable it for that use case only.
6. Kill zombie schedules
Hourly dashboards nobody opened this quarter are a warehouse that never
sleeps. Cross-reference query_history with BI usage. Disable the
schedule or raise the grain to daily.
The same applies to Tasks that still run after the product died.
7. Set resource monitors
The circuit breaker:
create resource monitor monthly_cap
  with credit_quota = 500
  frequency = monthly
  start_timestamp = immediately
  triggers
    on 75 percent do notify
    on 100 percent do suspend;
Attach it to the warehouses that can surprise you (dev, ad-hoc, a new vendor tool). Notify at 75% so you have time to act. Suspend at 100% on non-prod first; prod suspends need a page-ready owner.
Monitors do not cap Cortex tokens or storage. Those are separate bills. See the Cortex guide.
Query tags and a hard timeout
A warehouse shared by dbt and a BI tool is a mystery until every job sets a tag. Then Monday’s credit spike has a name.
alter session set query_tag = 'dbt:fct_orders:prod';
alter warehouse transforming set statement_timeout_in_seconds = 1800;
Thirty minutes is plenty for a well-partitioned incremental. A runaway Cartesian product should die, not finish the month’s credits. Put the timeout on the warehouse, not only in a worksheet you close.
flowchart LR
  dbt[dbt models] --> t[transforming]
  bi[Dashboards] --> b[bi]
  copy[COPY / Snowpipe] --> l[loading]
  t --> meter[ACCOUNT_USAGE]
  b --> meter
  l --> meter
One warehouse per job type. Metering is readable only after you split.
Result cache is not a strategy
Snowflake can return a cached result when the SQL text and the underlying data have not changed. That is a gift for a repeated worksheet. It is not a warehouse-sizing plan.
Do not “optimize” a dashboard by hoping the cache hits. If the underlying table ticks every five minutes, the cache will miss and you will pay the warehouse again. Materialize the grain. Then the dashboard is cheap for a different reason.
RESULT_SCAN(last_query_id()) is for chaining worksheets, not for
production jobs.
COPY and Snowpipe are not “free compute”
COPY INTO still wakes a warehouse. Snowpipe has its own credit
meter. A landing job that lists a million tiny files will spend
more on listing than on bytes.
select
  pipe_name,
  sum(credits_used) as pipe_credits
from snowflake.account_usage.pipe_usage_history
where start_time > dateadd(day, -30, current_timestamp())
group by 1
order by 2 desc;
If the pipe is expensive, fix file size (aim for a few hundred MB compressed) before you buy a larger loading warehouse.
Time Travel and storage
Compute is the noisy line item. Storage from long Time Travel on bronze is the quiet one. Set retention in the table PR. Details in Time Travel.
The habit that matters
Fifteen minutes every Monday: top warehouses, top queries, any warehouse
that did not suspend. Put the two ACCOUNT_USAGE queries in a saved
worksheet. Cost work that is only a Q4 project always returns.
What I watch after a change
- Credits per warehouse vs last week (same weekday)
- Share of queries with
partitions_scanned = partitions_total - Warehouses with zero auto-suspend events
- Time Travel bytes on bronze (see Time Travel)
If credits dropped and dashboards got slower, you sized down a job that does not scale. Put it back one size and fix the SQL.
FAQ
Does a bigger warehouse always cost more? Per hour, yes — each size doubles. Per query, no: a Large that finishes in half the time of a Medium can break even. Test a representative run.
Will auto-suspend at 60 seconds hurt BI? It can, because you lose the warehouse cache. Keep 5–10 minutes on the BI warehouse; use 60 seconds on ELT.
Do resource monitors cap Cortex and storage? No. They cap warehouse credits on the objects you attach. Token and storage bills are separate.
Should I cluster every large table?
No. Cluster tables that are filtered the same way and large enough
that pruning pays for automatic clustering. Check
automatic_clustering_history.
Is SELECT * a cost bug? On columnar storage, yes — you pay to scan columns nobody needs. Name the columns on hot queries.
What this means for data engineers
Cost work is a weekly habit: metering, top queries, then one knob. Do not wait for finance to forward the invoice.
Senior Data & AI Engineer · SnowPro Core & Gen AI Certified
4+ years building production data platforms on Snowflake, Databricks, AWS, and Azure. I write from hands-on experience with Medallion architectures, dbt, Airflow, PySpark, and Snowflake Cortex AI. Every tutorial on this blog reflects real pipeline decisions — not documentation rewrites.
Read more about the author →